Helping Students See How Graphs Work
Guide students to see past what graphs look like and understand what they represent using free online animations.

Students see graphs in their daily lives, and they sketch and interpret graphs in math classes. But what do they think graphs represent?
They might think that different looking graphs show different things. Yet teachers know that two graphs that look different can represent the same thing. When teachers focus on the relationships between the attributes included in the graphs, they can help students to move beyond what graphs look like to what graphs represent.
When students use graphs to investigate and represent those relationships, they have opportunities to make more meaning from the graphs. These learning opportunities can make all the difference.
That’s why I worked with Dan Meyer and the team at Desmos, a free browser-based application, to develop Cannon Man and other interactive activities. Cannon Man links dynamic animations and graphs in a sequenced, interactive learning experience. Students move through a progression of 14 screens, which they can complete at their own pace.
The Cannon Man Learning Experience
Students begin by viewing a video of Cannon Man, who is shot straight up into the air and then falls straight down, with his parachute opening near the end of his trip. After viewing the video, students might notice many different attributes—the path that Cannon Man takes, his height from the ground, his speed before and after his parachute opens. The exercise directs students to focus on two attributes in particular: Cannon Man’s height from the ground and his total distance traveled (both up and down).
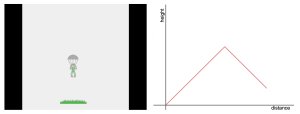
Next, students manipulate dynamic segments to show how Cannon Man’s height and total distance are changing. Then they sketch a graph to represent a relationship between his height and total distance. After sketching the graph, they answer some reflective questions. They repeat this process with Cannon Man’s height and total distance represented on different axes. This gives students the opportunity to use graphs to represent relationships between attributes.
To create Cannon Man, I gathered inspiration from different sources, including existing activities on Desmos such as Function Carnival. A number of researchers inspired my work: Jim Kaput’s SimCalc MathWorlds software, Patrick Thompson’s theory of quantitative reasoning, Kevin Moore’s work with breaking conventions, and Ference Marton’s variation theory.
Cannon Man gives students real-time feedback on their work, and teachers can collect student responses. And Cannon Man creates several other opportunities:
Make sense of attributes represented in a graph: If students are going to use graphs to represent relationships between attributes, they need to make sense of those attributes. To frame the activity, it’s helpful for teachers to provide opportunities for students to discuss different attributes they notice. The Cannon Man video helps to orient students to the situation and the different attributes.
Show how they might measure each attribute: It’s not enough for students to become familiar with attributes. It’s also important for them to think about how they might measure each attribute. It’s not necessary for students to come up with particular measurements. For example, they might wonder how they can measure Cannon Man’s total distance traveled, because Cannon man does not move from left to right. Teachers can help students to think about distance as the accumulated journey, both up and down.
Represent how each attribute can change: Graphs represent more than one attribute. It’s useful for students to think about how each attribute can change. In Cannon Man, they can use dynamic segments to represent how each attribute can change. Then they can view a computer animation of the dynamic segments.
Use a graph to represent a relationship between changing attributes: Once students have explored individual attributes, they can use a graph to represent a relationship between those attributes. It’s useful for students to move beyond a focus on what graphs look like to a focus on what graphs represent. In Cannon Man, they can use a variety of tools to sketch different kinds of graphs. They can receive real-time feedback by viewing a dynamic computer sketch of a graph.
Use a different graph to represent the same relationship: To continue to investigate relationships between attributes, it’s helpful for students to represent relationships in different ways. It’s typical for students to have opportunities to use different types of representations, such as a table or equation instead of a graph. With Cannon Man, students have opportunities to represent the same relationship with a different graph.
Three Takeaways
How students think about the attributes matters: Give students opportunities to make meaning of the attributes before representing them in a graph. To promote students’ thinking about attributes, teachers can ask questions such as: “Can you show me where you see Cannon Man’s distance? How might you measure it?”
Focus on both the whole and the parts: Have students represent change in individual attributes first and then change in both attributes. To promote students’ thinking about changing attributes, ask questions such as: “How does moving the dynamic segment right and left show that Cannon Man’s height is increasing, then decreasing?”
Two graphs are better than one: Have students use more than one graph to show the same relationship. To keep a focus on relationships, teachers can ask questions such as: “How can a single graph show both attributes at the same time?”