Promoting Data Literacy in Elementary Math
Students can discover how data applies to their lives by tracking information found in activities that capture their interest.
Your content has been saved!
Go to My Saved Content.
Data is all around, but how can we encourage students to notice data in their lives? We have the unique opportunity as educators to help mathematicians see that data can be collected or interpreted in the songs they listen to, the movies they watch, the pictures they view, the video games they play, etc. Our role is to guide students in becoming data literate. Promoting data literacy in the math classroom will help students navigate this modern world and promote classroom discourse around data sets.
We reflected on the data visuals that students encounter and immediately thought about using multimedia. Incorporating music, pictures, and/or songs presents a creative way to get mathematicians to interpret data. This classroom experience motivates and piques students’ curiosity around data. Learning occurs simultaneously while connections to real-world encounters are being made.
Promoting Data Collection with Images
Images are an engaging starting point for data collection in your classroom. Inspired by Slow Reveal Graphs, students can use photographs to create their own data visualizations. Choosing from a varied collection of photographs (buttons in a drawer, cars in a parking lot, people on a beach), each student observes, noticing colors, shapes, sizes, and patterns, thus launching their own visual exploration to gather and analyze data.
Students were especially invested since they had the opportunity to choose the data on which they would focus their visual representation. It’s interesting to see what pulls students’ focus within each image. Having students build their graphs in parts and reveal them slowly was a fun and engaging way to share.
Once students zoomed in on a particular data component, they created their own pie charts and bar graphs. For example, one student created a bar graph that showed the frequency of different car colors in a parking lot. Another student constructed a pie chart illustrating the proportion of different building shapes. Students saw the connection between what they observed and the data they created.
Finding Data in Songs
Students can build connections with each other by listening to their favorite songs. As a class, we loved “The Family Madrigal,” from Disney’s Encanto. We discussed how mathematicians can view data through many different lenses. In this case, we chose to focus on words. Every time we heard the words “family,” “Mirabel,” or “Madrigal,” we recorded a tally next to that word—creating a frequency chart as a whole class. After modeling, students were tasked to listen to the song again and create their own graph based on new words from the song. Our young mathematicians were focused and determined to have an accurate data set. When we looked around the room, at that moment, we knew students were engaged.
Students also had the opportunity to choose a song with a partner, whereby they chose a song and created a data set. Most students decided to stick to the word lens when listening to their song, but a few partnerships expanded their data lens to think about instruments or the different voices they heard. Through this rewarding experience, we learned that songs can be a motivational tool to help students build their data literacy skills while making social connections with their peers.
Studying Short Films to Interpret Data
Students of all ages encounter videos daily, so we wanted to provide ours with an opportunity to reflect on a video through the data-collection lens. Using short films as a learning tool can help promote classroom discourse, build connections, and, in our case, serve as a data-collection experience. Students had a choice on which short film to watch, and the class was split into two groups, depending on their choice.
Students were tasked with creating a statistical question around the short film. These young mathematicians were determined to create a question that motivated them to collect data. For example, when reflecting on the short film Pip, students created statistical questions around the weights of dogs and the dog food presented in the video.
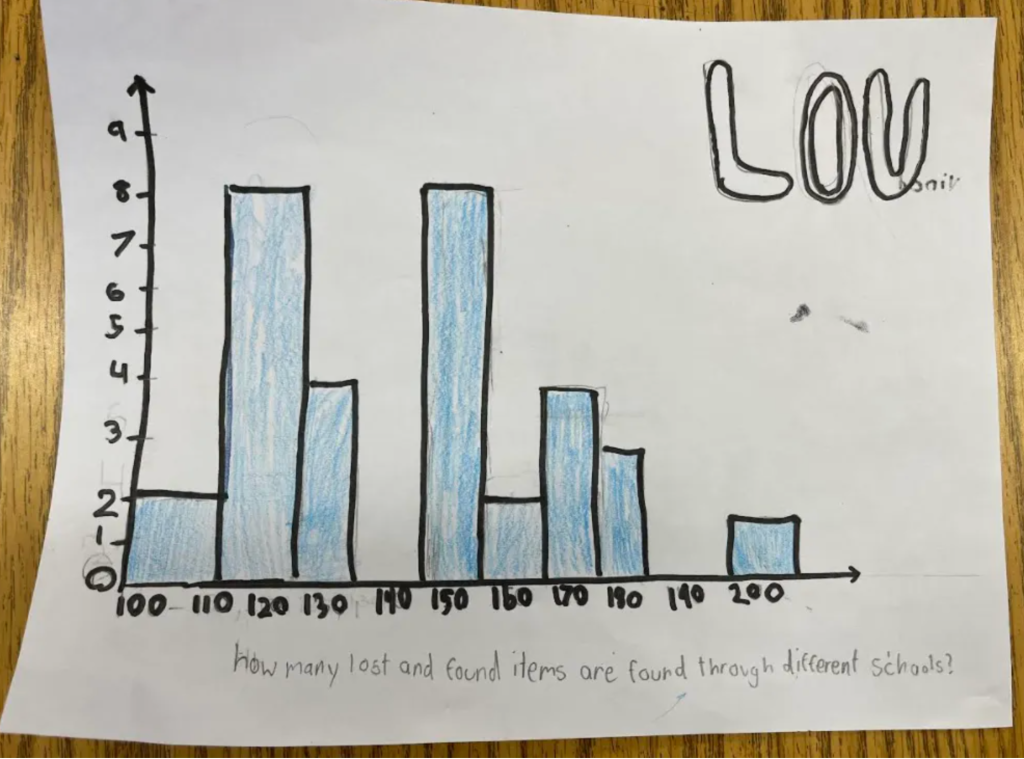
After collecting data from watching the film, the mathematicians created a histogram to present their findings. This collaborative task not only helped them practice organizing data but also fostered a data-literate mindset. It emphasized key aspects of data literacy: interpretation, creation, and communication. Students engaged in meaningful discussions with their peers and recognized the importance of connecting data to real-life situations.
Expanding Data-Collection Opportunities
There are opportunities throughout the school day to launch a data exploration! Here are some other ways that students can engage with the data around them.
- Books: Consider adding some data analysis into your read alouds or book clubs. Students can track characters’ feelings or changes or notice the frequency of themes across books read.
- Nature: Invite students to be data collectors on a nature walk, making observations about plants, insects, weather patterns, colors, or shapes. Back in the classroom, students can analyze and discuss their findings, making connections to each other and possibly grade-level science standards.
- Locations: Get students tracking and analyzing foot traffic in different areas of the school, identifying the most visited spots or mapping out the safest routes. This can be a great way to incorporate geography and social studies into data lessons.
- Maps: Use maps to show how data, like population density or climate zones, is visualized. Students can analyze how colors and symbols convey specific information on each map.
These possibilities are fun and versatile. You can apply them across different subjects and grade levels. These activities encourage students to think critically, collaborate, and make connections between data and the world around them.
You can make data collection and analysis an engaging and meaningful experience for your students by incorporating images, songs, short films, and more. Incorporating data literacy benefits students in their academic careers and future lives. Engaging students with data through creative media not only makes learning more interactive but also prepares them to be informed citizens of the world, ready to engage critically with the information they encounter.